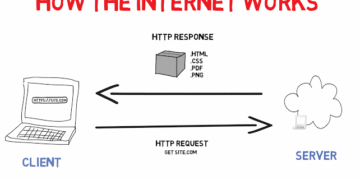


Figure1
When evaluating system performance, it is not enough to rely on a single metric like the average response time. To truly understand how users experience your system, you need to look deeper, particularly at percentiles, which provide a more accurate representation of performance across different scenarios.
The Median (p50): A Better Measure of Typical Experience
The median, also known as the 50th percentile (p50), represents the midpoint of all response times. In simple terms:
- Half of all user requests are completed faster than the median
- The other half take longer than the median
This makes the median a useful metric for understanding what a “typical” user experiences. For example, if the median response time is 200 milliseconds, it means that 50% of users receive responses in under 200 ms.
However, there is an important nuance: users rarely make just one request. A single webpage, for instance, may trigger multiple requests for images, scripts, and data. As a result, the probability that at least one of those requests is slower than the median increases significantly. This means that even if your median looks good, users may still encounter noticeable delays.
Looking Beyond the Median: High Pe rcentiles (p95, p99, p999)
To understand worst-case scenarios and outliers, engineers rely on higher percentiles, such as:
- p95 (95th percentile)
- p99 (99th percentile)
- p999 (99.9th percentile)
These metrics show the threshold below which a certain percentage of requests fall.
For example:
- If your p95 response time is 1.5 seconds, it means:
- 95 out of 100 requests complete in under 1.5 seconds
- 5 out of 100 requests take longer than 1.5 seconds
These higher percentiles are critical because they reveal the experiences of users who encounter delays, the very users most likely to notice performance issues.
Why High Percentiles Matter for Business Outcomes
High percentiles are not just technical metrics,they have direct business implications.
For example:
- Companies like Amazon define performance targets using extremely high percentiles such as p99.9
- Even though this affects only 1 in 1,000 requests, those requests often belong to highly engaged or high-value users
Research and industry observations have shown that:
- A 100 ms increase in response time can reduce sales by approximately 1%
- A 1-second delay can reduce customer satisfaction by as much as 16%
These numbers highlight an important reality: small delays can have a disproportionate impact on user behavior, revenue, and retention.
The Trade-Off: When Optimization Becomes Too Expensive
While improving performance is important, there are limits to how far optimization should go.
For instance:
- Optimizing for p99.99 (1 in 10,000 requests) can be extremely costly
- These extreme outliers are often influenced by unpredictable factors such as network instability or hardware interruptions
- The benefits of improving such rare cases are often minimal compared to the cost involved
This introduces the concept of diminishing returns,beyond a certain point, further optimization yields little practical benefit.
Smart system design involves balancing performance improvements with cost efficiency, focusing on areas that deliver the greatest impact.
Percentiles in SLAs and SLOs
Percentiles are widely used in defining Service Level Objectives (SLOs) and Service Level Agreements (SLAs).
These are formal commitments that specify expected system performance and availability. For example, an SLA might state:
- Median (p50) response time must be less than 200 ms
- p99 response time must be under 1 second
- System uptime must be at least 99.9%
If these conditions are not met, customers may be entitled to compensation or refunds.
Such agreements help:
- Set clear expectations for users
- Hold service providers accountable
- Ensure consistent performance standards
The Hidden Factor: Queueing Delays
One of the biggest contributors to slow response times, especially at high percentiles, is queueing delay.
Every server has limited capacity. It can only process a certain number of requests simultaneously, depending on factors like CPU cores and available memory. When too many requests arrive at once:
- Some requests must wait in a queue
- Even a few slow requests can block others
- This leads to increased delays, particularly for users at the tail end (high percentiles)
This is why systems that appear fast on average can still perform poorly under peak conditions.
Conclusion: Focus on What Users Actually Experience
Understanding percentiles is essential for building systems that deliver consistent and reliable performance.
Key insights include:
- The median (p50) reflects typical user experience but is not enough on its own
- High percentiles (p95, p99, p999) reveal the true impact of slow requests
- Small performance degradations can significantly affect business outcomes
- Over-optimizing extreme outliers may not be cost-effective
- Queueing delays play a major role in performance degradation under load
Performance is not just about averages—it is about ensuring that all users, including those at the edges, have a smooth and responsive experience.