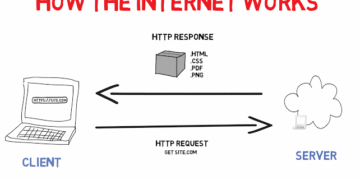


Figure1
Once you have a clear understanding of the load on your system, the next critical step is to evaluate how that system performs under increasing demand. Performance is not just about whether a system works—it is about how efficiently and consistently it responds as conditions change.
Understanding performance allows engineers to answer two fundamental questions:
- What happens to system performance when load increases but resources remain the same?
- How much must resources (CPU, memory, bandwidth) increase to maintain consistent performance as demand grows?
Answering these questions requires meaningful performance metrics and a deeper understanding of how systems behave in real-world conditions.
Throughput vs Response Time: Choosing the Right Metric
Performance can be measured in different ways depending on the type of system.
In batch-processing systems such as data pipelines, the focus is typically on throughput, the number of operations or records processed per second, or the total time required to complete a job.
However, in online systems such as web applications or APIs, the most important metric is response time. This refers to the total time between when a client sends a request and when they receive a response.
For user-facing applications, response time directly impacts user experience. A delay of even a few hundred milliseconds can significantly affect user satisfaction and engagement.
Latency vs Response Time: Understanding the Difference
Although often used interchangeably, latency and response time are not the same.
- Response time is what the user experiences. It includes:
- Processing time (service time)
- Network delays
- Queueing delays
- Latency, on the other hand, refers specifically to the time a request spends waiting to be processed.
In simple terms, latency is a component of response time. Understanding this distinction is important when diagnosing performance issues, as delays may originate from different parts of the system.
Why Averages Can Be Misleading
It is common to report performance using the average (mean) response time. This is calculated by summing all response times and dividing by the number of requests.
While this metric is easy to compute, it often fails to reflect the true user experience.
The problem with averages is that they can hide variability. A system may appear fast on average while still delivering poor performance to a significant number of users. For example, if most requests are fast but a few are extremely slow, the average may still look acceptable,even though some users are experiencing serious delays.
Using Percentiles for Better Insight
To get a more accurate picture of performance, engineers use percentiles.
When response times are sorted from fastest to slowest:
- The median (50th percentile) represents the middle value
- The 95th percentile (p95) shows the response time under which 95% of requests fall
- The 99th percentile (p99) highlights the worst-case scenarios experienced by a small percentage of users
For example:
- If the median response time is 200 ms, it means half of all requests are completed in less than 200 ms, while the other half take longer
- If the p95 is 800 ms, it means 5% of users experience delays longer than 800 ms
Percentiles provide a clearer understanding of how performance is distributed across users, especially when identifying slow or problematic requests.
Performance as a Distribution, Not a Single Value
In real-world systems, response time is not constant, it varies from request to request. Even when the same operation is repeated multiple times, the results will differ slightly.
This variability occurs because performance is influenced by many unpredictable factors, including:
- Background processes consuming system resources
- Network instability or packet loss
- Garbage collection pauses in managed runtimes
- Disk access delays (e.g., page faults)
- Queueing delays during traffic spikes
- Hardware-level factors such as system interrupts
As a result, performance should always be viewed as a distribution of values, not a single number. Visualizing response times as a distribution helps identify patterns such as:
- Most requests being fast
- Occasional slow outliers
- Consistent performance degradation under load
Understanding this distribution is key to building systems that perform reliably under varying conditions.
The Impact of Outliers on User Experience
Outliers-those unusually slow requests, can have a disproportionate impact on user experience. Even if only a small percentage of users encounter delays, those experiences can lead to frustration, reduced trust, and lost engagement.
In many systems, improving the worst-case performance (e.g., reducing p99 latency) is more valuable than improving the average. This is especially true for applications where responsiveness is critical, such as financial services, real-time communication platforms, or e-commerce websites.
Scaling Performance with Increasing Load
As load increases, maintaining consistent performance becomes more challenging. Systems may experience:
- Increased queueing delays
- Resource contention (CPU, memory, I/O)
- Network congestion
- Higher failure rates
To address this, engineers must determine how to scale resources effectively. This may involve:
- Adding more servers (horizontal scaling)
- Increasing system capacity (vertical scaling)
- Optimizing code and database queries
- Implementing caching and load balancing
The goal is not just to handle more requests, but to do so without degrading performance.
Conclusion: Measuring What Matters
Describing performance is essential for building systems that are both reliable and scalable. By understanding how systems behave under load, engineers can make informed decisions about architecture, resource allocation, and optimization strategies.
Key takeaways include:
- Performance must be evaluated in context, based on system type
- Response time is critical for user-facing applications
- Averages are insufficient—percentiles provide better insight
- Performance should be treated as a distribution, not a single metric
- Outliers matter and should not be ignored
Effective performance measurement is about more than just numbers; it is about ensuring that systems deliver consistent, reliable experiences for all users, even as demand continues to grow.


